Using public transportation in a city new to you? With Trajetos you get off the bus at the right spot whilst learning about surrounding places of interest.
Summary
| Kind: Graduation Project | Keywords: Transit, Information Architecture, Wayfinding, Geolocation | Year: 2012 |
| Duration: one year. | My Role: Research, UI/UX Design, Programming, Video Production |
Challenge: The lack of easily accessible public transportation information challenged me to explore how people perceive and navigate in the city, and also to create a research-based mobile app to help people reach their destination.
As a person who likes to travel a lot and who primarily gets around in the bus, I started to notice many shortcomings in the way mapping tools and services like Google Maps work and the way ordinary people understand, communicate and locate themselves in the urban space.
Here I present some highlights of the research, reference material, and the creative process to design and code the app concept prototype.
Background and Inspiration
I became interested in researching public transportation, transit information, wayfinding and urban planning sometime around the end of my graduation.
The project started with a literature research on the various methods for understanding and making sense of cities and resulted in the prototyping of a web app for mobile devices.
Ultimately, the inspiration for this project came from the general lack of mass transit information and the fact that. to this day, many people in my hometown Vitória, and in many places in the world, use landmarks as the main part when asking for directions.
Similar to Vitória, people in the city of Beirut also use common knowledge such as landmarks to navigate and find their destination.
Literature Research
In the book The Image of the City, Kevin Lynch lists five distinct urban elements which are fundamental to how the urban environment is observed and understood:
- paths — the streets, sidewalks, trails, and other channels in which people travel;
- edges — perceived boundaries such as walls, buildings, and shorelines;
- districts — relatively large sections of the city distinguished by some identity or character;
- nodes — focal points, intersections or loci;
- landmarks — readily identifiable objects which serve as external reference points.
These elements created the foundation I used to develop the app. Later in the book, Lynch would describe their importance for developing some orientation strategies:
In the orientation process, the strategic link is the image of the environment, the generalist mental image of the exterior world held by the subject. This image is the product of the immediate perception and past experienced memories.
Kevin Lynch, 1980
At the same time, I began walking and riding on some unusual bus lines in Vitória, taking quick notes and listing some of the features and landmarks that caught my attention the most. Of course, trying to see your hometown with new eyes is somewhat difficult, but an important exercise to make.
Different streets, neighborhoods, and landmarks provide unique visual cues used as affordances for urban explorers.
Another important aspect during my research was understanding how people process and express geospatial concepts in their own way.
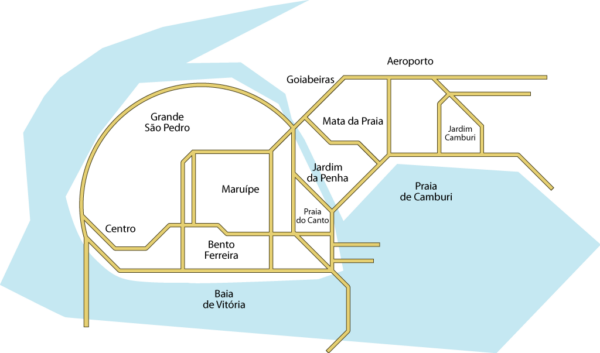
Much of the details that exist in our physical environment are compressed and abstracted away. One’s visual representation when giving directions resembles more a diagram than a cartographic map. Gone are details like precise street angles, shapes and distances. In place, there are lines intersecting at forty five, sixty, and 90 degrees. The London tube map, for example, is a rational, abstract representation of a system that favors legibility and information density to physical accuracy.
Aris Venetikidis explained exactly this train of thought during his talk at the 2012 TEDxDublin conference, a comprehensive case study for making sense of maps.
Either way, that’s to say that both detailed maps and schematics are abstract representations of our reality but each one favoring an aspect they want to focus on.
Design
Moving on, I started working on the design of the app itself and a requirement I did settle with early on was that this app had to run on mobile browsers.
I tried many different concepts for how to display transit itinerary while also aggregating other type of media and information. Some ideas were borrowed from apps like now defunct Path, Google Maps, Foursquare, and other timeline-driven apps.
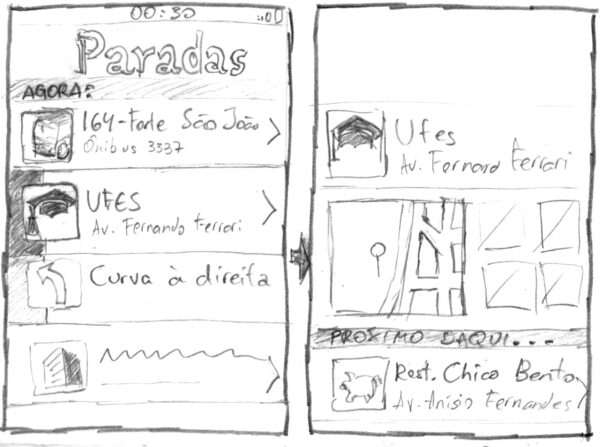
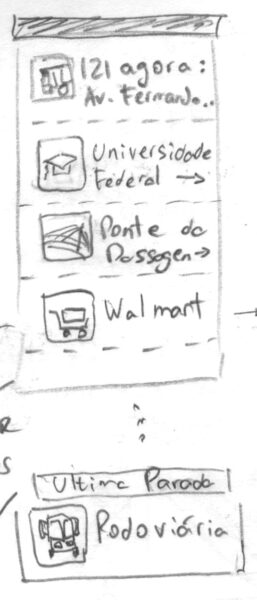
Working in some early designs, sketching on paper was crucial to iterate quickly.
Low fidelity wireframes showing the app main timeline interface, as well as some of the itinerary information, including landmarks, icons, and street names.
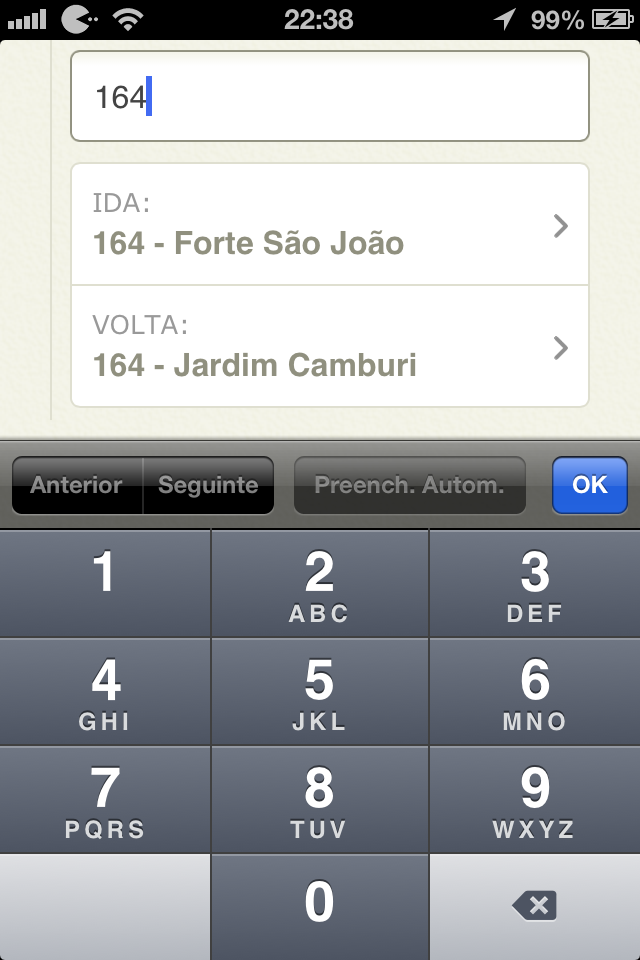
Additionally, to support the development and testing of the prototype, I mapped the complete route of a couple different bus lines, including the popular 164 line connecting the Forte São João and Jardim Camburi neighborhoods in Vitória.
Speaking of bus routes, all public transportation data I needed for this project, such as bus stops locations, line names, etc, wasn’t readily available through some kind of API, so I had to scrape those from the city’s restrictive transit website, making the whole process a lot more complex to begin with.
Development
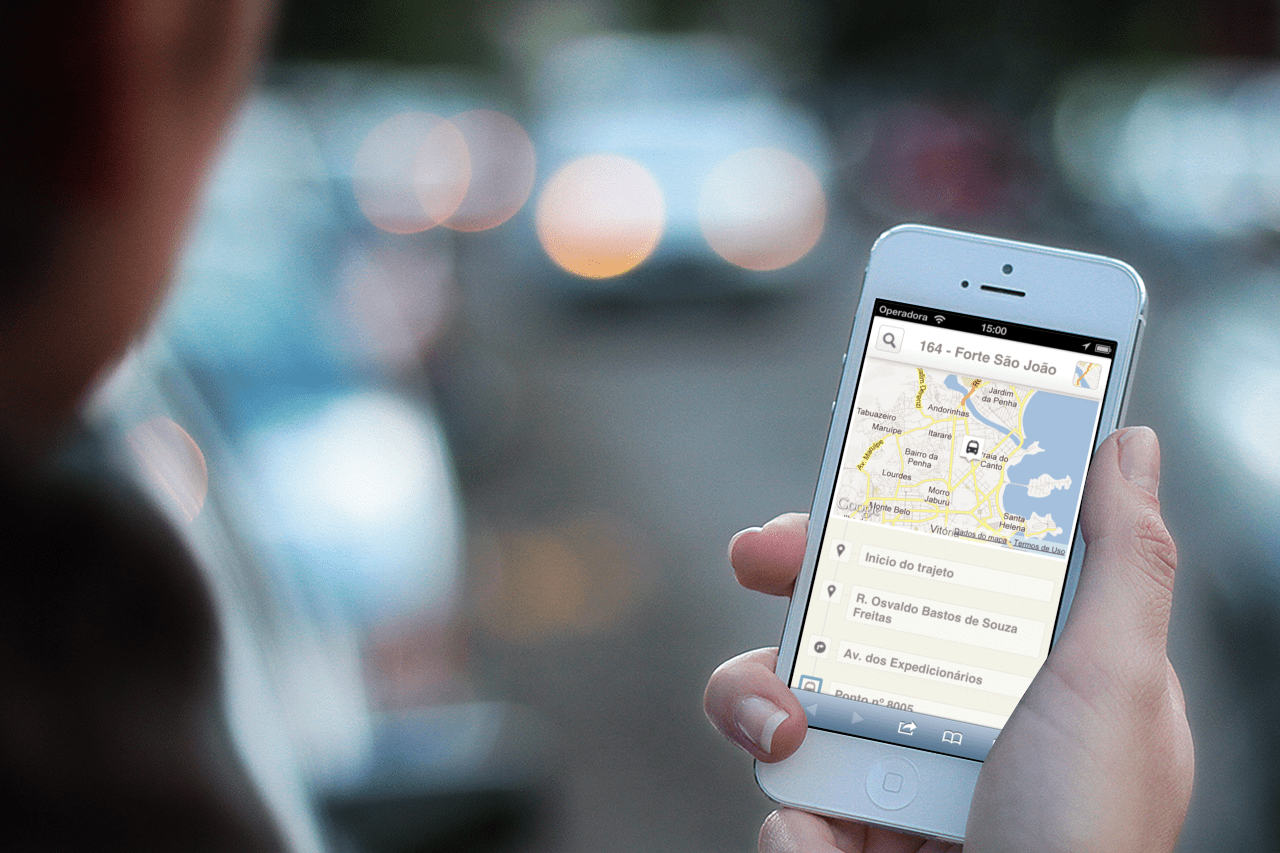
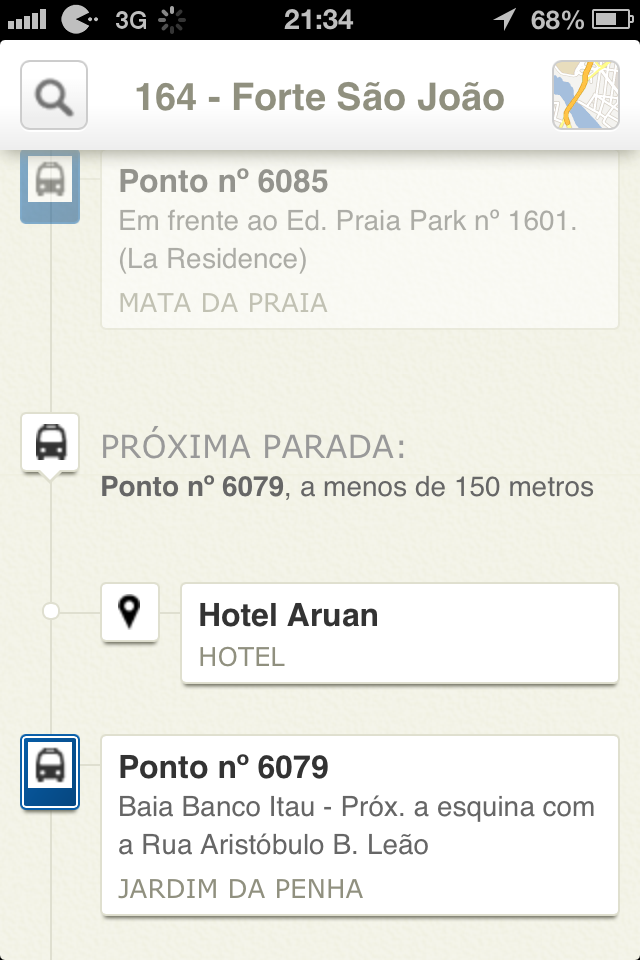
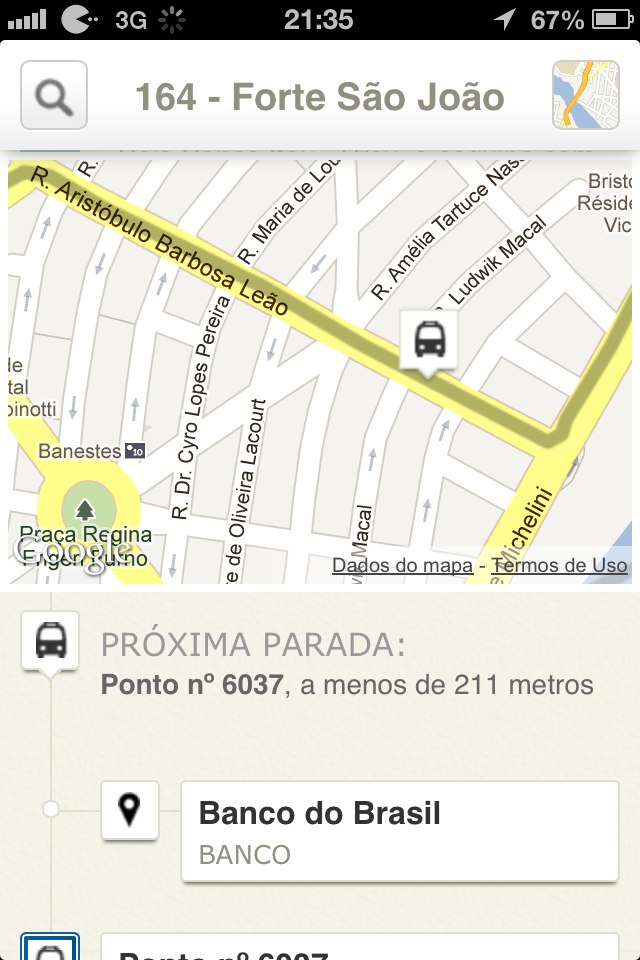
The app works by tapping into the user’s smartphone location data and placing it in a timeline-like interface which lists the next bus stops, road names, points of interest and street view level images. The user can also open a map to get a higher level view of the bus route.
This switching of abstraction on information systems has been also present in the work of Bret Victor on the essay Up and Down the Ladder of Abstraction.
How do we explore? If you move to a new city, you might learn the territory by walking around. Or you might peruse a map. But far more effective than either is both together — a street-level experience with higher-level guidance. Likewise, the most powerful way to gain insight into a system is by moving between levels of abstraction. […]
Bret Victor, October 2011
Much effort was put into making sure the experience using the app was fast and fluid. To achieve this, I used CSS transitions to smoothly move the timeline items from one place to another.
The prototype made heavy use of JavaScript, the Zepto.js framework, and the Google Maps API, for measuring distances, displaying route information, and retrieving the user’s device current location. There was also some PHP involved to help streamline the process of fetching and parsing the data.
End Result
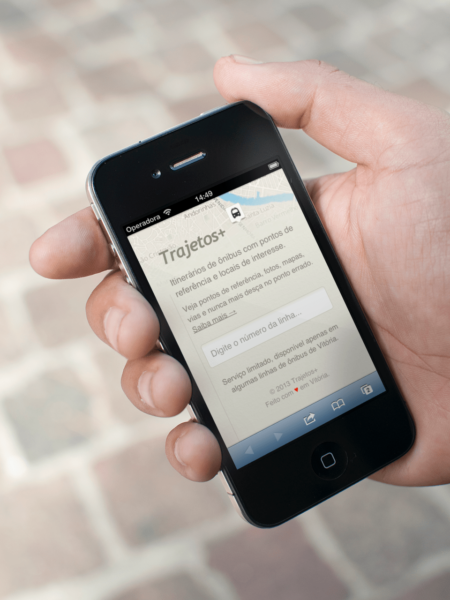
Using public transportation in a city new to you? With the Trajetos app you get off the bus at the right spot whilst learning about surrounding places of interest. It works on the browser so you don’t have to download anything!
“It’s like Google Maps’ directions but for riding the bus with ease.“
View landmarks, points of interest, photos, route information, and never get off the bus in the wrong stop ever again!


Finally, I created a small videoclip to illustrate a common use case o the app. In the video, a man uses the app to be notified when he’s about to reach his destination.
Final Thoughts
The code for the Trajetos app prototype is available on Github. Fork it or download the corresponding research paper (PDF, Portuguese only).